A More User-Friendly Way to Track Liquidity

“Return on Equity” provides a general indicator of the level of earnings and operational cash flow a firm generates in relation to the cost of long term capital invested in the enterprise. As many entrepreneurs realize, “cash flow is king and queen” in a company’s financial management practices. But most traditional liquidity measures have inherent weaknesses, especially at privately held firms headed by entrepreneurs with little or no financial background. An alternative cash flow metric, the Net Balance Position (NBP) provides a simpler yet more effective way to measure the liquid situation of these firms. This article explains why, and shares some strategies that can increase cash flow of the enterprise.
Traditional Liquidity Measures: Current Ratio and Quick Ratio
Traditional financial statements include a “Statement of Cash Flows” as part of the financial statements for external reporting. In addition, two traditional ratios – the current and quick ratio – are utilized to measure the ability of a firm to pay its bills. The following section summarizes each of the ratios and explain why they might not be the most effective measurements for a growing private enterprise.
Current Ratio
Current Ratio = Current Assets/Current Liabilities
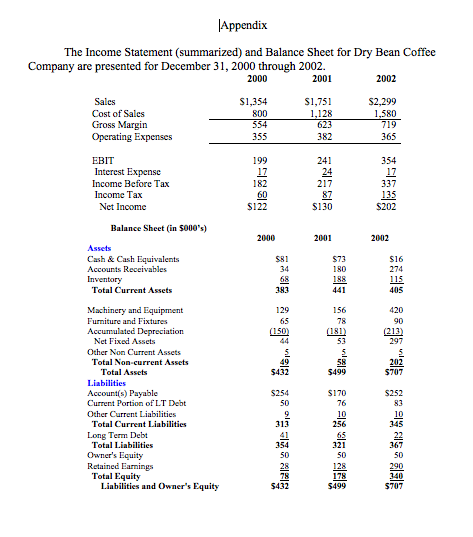
The current ratio is commonly used by bankers and financial analysts to ascertain the solvency of a company. To illustrate, Table 4.X shows the current ratio for Dry Bean Coffee Retailers, a retail coffee shop located in a Midwest college town. (The Dry Bean Income Statement and Balance Sheets for 2000, 2001 and 2002 are presented in the Appendix section).
Using Dry Bean data from the balance sheet for 2000 through 2002 the current ratios are ($’s in 000’s):
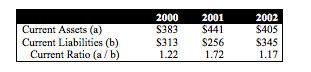
A “rule of thumb” suggests that a current ratio should be 2 or higher to indicate that an organization can adequately meet its current obligations. Examining Dry Bean’s data, the current ratio ranges from a low of 1.17 in 2002 to a high of 1.72 in 2001. Using that rule of thumb, the data indicates that Dry Bean may be nearly insolvent.
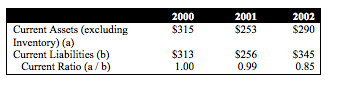
A second ratio used is a derivative of the current ratio, or the “quick ratio” (also called the “acid test ratio.”) This calculates solvency excluding inventory from the current asset calculation.
Quick Ratio = (Cash + Marketable Securities + Accounts Receivable)/Current Liabilities)
By eliminating inventory from the numerator, financial analysts believe that the quick ratio includes only those current assets that can be quickly converted to cash. The “rule of thumb” says that a quick ratio of 1 or better is desirable because it shows that the company has enough liquid assets to pay current debts.
The quick ratio for Dry Bean closely follows the trend of the current ratio. In 2000, the company had just enough liquid assets (cash, accounts receivable, etc.) to cover their current liability obligations. Using both the current and quick ratios, Dry Bean’s short-term financial condition appeared to be deteriorating in 2002 as accounts payable increased more dramatically than current assets.
Net Balance Position (NBP)
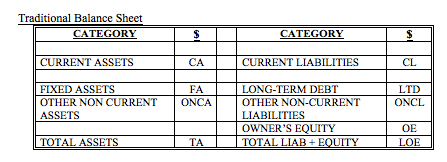
Traditional balance sheet reporting presents the items three major categories – assets, liabilities, and equity – in order of their estimated life on the balance sheet (i.e., assets in order of liquidity, liabilities and equity in order of how soon the obligations must be paid off ). This presentation format helps financial professionals and others to make sure the balance sheet is in "balance" (i.e., assets = liabilities + equity). Financial experts understand that when facing the balance sheet, the liability and equity accounts on the "right" side of the balance sheet finance the resources categorized as "assets" on the left side.
However, for business owners/entrepreneurs with little or no financial background, the traditional format for the balance sheet is confusing because it provides little meaningful information for real-time decision-making, such as: "Does the organization have the cash flow to stay in business?”
Secondly, the two ratios for monitoring the liquid position of a company, the current and quick ratios, are ideally suited for large firms with ample borrowing capacity and plenty of cash flow. For many small businesses, especially those considered “cash-based” businesses (i.e., little or no accounts receivables and/or inventory) with little or no current assets other than the cash they have in the bank, the current and quick ratios may not accurately reflect the financial position of the company. Many times, the two traditional liquidity ratios will be at exceedingly low levels (i.e., below 2 for the current ratio and below 1 for the quick ratio) because cash-based firms will utilize their current liabilities as a means to finance both their working capital needs and long-term assets. Such conditions may suggest liquidity problems that in fact don’t exist, limiting their ability to obtain bank loans for short-term capital needs. The Dry Bean company is an accurate example of this circumstance; its quick and current ratios declined even when it made a net income of $202,000 in 2002.
Finally, many enterprises rely on their long-term capital (i.e., loans and owner’s equity) to finance most of their operations. Larger businesses will utilize current liabilities to fund current asset needs and long-term financing sources (debt and equity) to finance long-term asset needs such as property, plant and equipment. However, small firms will apply their entire liability and owner’s equity sources, whether current or non-current, to finance all operating needs. Any non-current financing source will not be reflected in the current or quick ratio, thus misstating the actual liquidity position of the firm.
This shows that small businesses need an alternative liquidity measurement that provides more useful, relevant information and overcomes some the intrinsic weaknesses of traditional liquidity ratios. The Net Balance Position (NBP) provides a simpler, more effective tool for these business owners and managers. It recognizes the reality that many entrepreneurial firms use their all liabilities and equity to finance a significant portion of their asset needs. NBP also is presented in a user-friendly format that allows the business owner/manager to quickly identify and develop solutions for the firm’s liquid needs.
Essentially, NBP rearranges the balance sheet from an accounting/financial report to a cash management financing statement. The items are ‘rearranged’ so that the end result provides the degree of cash needed to get a positive liquid position. It also makes several important assumptions that assist the business owner in developing financing strategy. The charts below illustrate how the NBP concept is different.
To understand the NBP metric, the balance sheet must be rearranged to reflect the realities of most small firms:
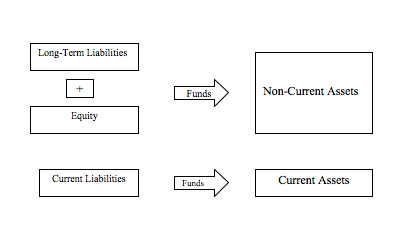
In other words, companies fund their non-current assets such as property, plant and equipment with non-current liabilities (i.e., long-term debt, leases, etc.) and owner’s equity (i.e., paid in capital, retained earnings) with the excess available to fund current operating needs. Any excess non-current liabilities and equity combine with current liabilities (payables, accrued expenses, short-term debt) to fund current assets like cash, accounts receivable and inventory. Any funds available beyond the current operating needs can be used for further investment, dividends or other miscellaneous needs. The chart below presents a re-organized balance sheet that more accurately illustrates this notion.
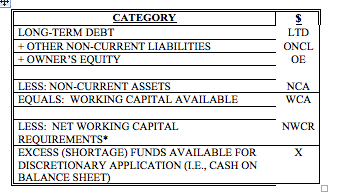
The “Reorganized Balance Sheet” symbolizes a firm’s financing mechanisms by emphasizing that the financial foundation or “permanent capital” funds the both the long-term asset investments and operating capital. Hopefully, an excess of cash exists to provide an operating cushion and the potential for a firm to invest in additional opportunities. In my experience, using this reorganized balance sheet makes the financial condition of the firm much clearer to the owner/manager than the traditional balance sheet format prepared using Generally Accepted Accounting Principles (GAAP).
Net Balance Position – Applied
The reorganized balance sheet presents the assets, liabilities, and equity in a layout that is more easily comprehensible to non-financial managers. Still, a balance sheet can be a complicated report, especially when it contains numerous account balances. The Net Balance Position (i.e., NBP) was designed to provide owners, managers, and financial consultants with an easy-to-use liquidity indicator. [1] NBP, builds on the reorganized balance sheet by comparing an organization’s long-term financing (i.e., long-term debt and equity) with its net fixed assets (such as buildings, land, and machinery) and other non-current assets (i.e., Working Capital Available, or WCA).
Then, NBP compares the capital available with working capital requirements to determine the firm’s liquidity position. The NBP is calculated as follows:
NBP = Working Capital Available – Working Capital Required
“Working Capital Available” (see chart below) is defined as the "Permanent Capital" in a firm’s financial structure as represented by Owner’s Equity and Long-Term Debt. Also, the NBP calculation considers a "revolving line-of-credit" as part of Permanent Capital (i.e., a revolving line of credit is a short-term loan between a business and lending institution usually used to fund financial needs caused by seasonality. Many times, a revolving line-of-credit, even though it’s classified as short-term on the balance sheet, is a "permanent" fixture of the long-term financing structure).
[1] Miller, J. (1987). Working Capital Theory Revisited in The Journal of Commercial Bank Lending, p. 45-61.
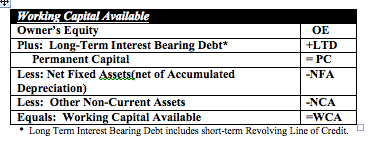
Finally, Net Balance Position includes any interest bearing lease obligations that are not due in the next twelve months. NBP excludes any debt obligations and lease obligations that are due within the next year as these items are part of the short-term financing structure similar to accounts payable.
Once permanent capital is computed, the next step is to assess how much of the permanent capital is “absorbed” to finance net fixed assets. Net fixed assets (NFA) is derived directly from the balance sheet as gross fixed assets less accumulated deprecation. The net result of permanent capital less net fixed assets provides the amount of capital, working capital available, present in the organization’s capital structure to fund ongoing working capital requirements. Using the financial data from the Dry Bean Coffee balance sheet (shown in the Appendix):
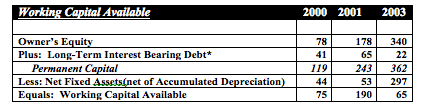
Dry Bean’s working capital available shows an increase in 2000 to 2001 of $75,000 to $190,000, respectively as the company experienced nice income growth retained in the business as retained earnings. However, WCA declines in 2003 as it pays off some interest-bearing debt and purchased almost $250,000 in fixed assets. Thus, at December 31, 2003, Dry Bean has $65,000 available to fund its working capital needs like inventory and accounts receivable.
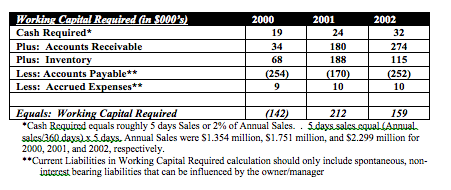
Working Capital Required
The Net Balance Position metric is designed to focus management on the crucial components of cash needs for the business, especially those that he or she can influence on a timely basis. The Working Capital Requirements calculation is presented below.
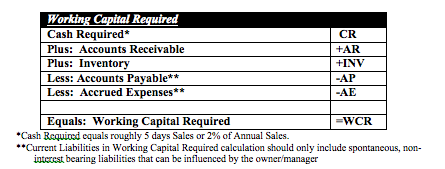
“Working Capital Required” (WCR) first assumes that an organization needs a minimal amount of cash on hand to handle daily operations and short-term emergencies. Experience indicates that minimal cash should approximate 5 days of sales or just over 2% of annual sales. While to many the 5-days sales amount may not provide a feeling of security, this level is implies to the business owner that if the venture needs more cash, it should be able to readily access liquid funds through faster collections of receivables, turning inventory faster, putting off payment to vendors, etc. Keeping cash funds to a minimum emphasizes that funds should be invested in productive activities of the company and not just sitting in a bank account earning low interest rates.
The other two main elements of gross working capital requirements are accounts receivable and inventory. Receivables, while usually being the largest absorbent of cash, are typically utilized by management as their quickest source of needed cash flow by encouraging customers to pay early, factoring sales, or turning them over for collection. Inventory, though not quite as liquid as receivables, represents “cash sitting on the shelves,” utilizing resources for acquiring and manufacturing materials converted to final products for resale. Additionally, inventory represents “hidden expenses” (i.e., carrying costs related to rent or depreciation on warehouse and retail space, insurance, property taxes, financing costs) that can sometimes add 20% or more on top of the inventory value.
NBP offsets gross working capital requirements with “non-interest bearing, spontaneous current liabilities” as it assumes management offsets its short-term working capital requirements by deferring payment of obligations. The distinction for using only non-interest bearing, spontaneous payables is that certain current liabilities such as employee payroll expenses, benefit expenses, and property taxes are excluded because management has little flexibility in deferring these payments as a means to conserve cash. The exclusion of such liabilities results in higher working capital requirements but is not all bad as it will force the owner/manager to take a more conservative approach to cash management as he or she must find other sources of cash flow.
Dry Bean’s Working Capital Requirements for 2000, 2001, and 2002 are presented below.
Calculation of Net Balance Position
Dry Bean’s Net Balance Position for 2001 – 2003 are shown below. Using NBP as an indicator of liquidity position, when a NBP is negative (i.e., below zero) immediate action must be taken by management to get the company into a positive liquidity position.
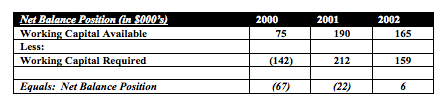
As shown in 2000 and 2001, Dry Bean was in a negative liquidity position, suggesting the company was in a precarious cash flow situation requiring action. At least in 2002, the firm moved into a slightly positive NBP at $6,000.
In 2000, NBP indicated that the company lacked the liquidity to pay its obligations, much less invest for future growth. Many times, an owner/manager feels trapped by such a situation without possessing much real-time information that can direct the company to where the major problems are. Too many times, an entrepreneur may feel the need to reduce costs rashly by deciding to lay off employees or to seek outside investments from the local banker or equity investors to alleviate the cash shortfall.
However, one of the additional strengths of NBP is that is provides a platform for making a series of operational decisions to improve the cash flow of the organization. The following sections will outline a series of steps that, taken individually and/or in combination, will direct the business owner to improve the firm’s cash liquidity.
Option 1: Increase Permanent Capital – Raise Prices/Improve Earnings
Under the NBP framework, permanent capital is the major funding source for the long-term and operational needs of a firm. The natural inclination is to seek outside financing, however, this is costly in both interest costs and time. Analysis of the retained earnings will show that capital can be obtained through two sources - improved profitability and/or lessening the dividends dispersed from the company. In most small businesses in the early stages of development, dividends distributions are small to non-existent. Thus focus should be placed on quick actions that can be taken to increase revenues, lower costs, or a combination of the two.
Immediate attention should be focused on the potential of raising prices. To many entrepreneurs/business owners, the vague thought of raising prices is the last thing they would do for fear for losing customers. However, a slight percentage price increase, even with a potential loss of volume, can cause a dramatic impact on the bottom line, as shown in the following example. Dry Bean found that the average price per unit of coffee was $4.77 based on 284,000 units sold in 2000. The company realized that they had not increased prices for over three years; thus the question was posed, “What would be the impact on a 1% or $0.05/unit price increase on bottom line and cash flow”?
Dry Bean Customer Variance Analysis
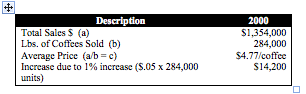
Assuming that no volume is lost and cost of goods sold are variable costs with all other expenses fixed, the change in price has the following impact on earnings:
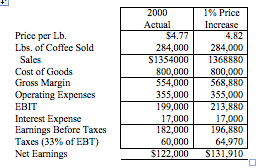
As a result of a 1% price increase concurrent with the assumptions made, Dry Bean could increase earnings and permanent capital by almost $10,000 without much impact on the company.
An alternative step is to grow earnings through higher market share (and resulting higher sales VOLUME). The potential downside to such a strategy is that the positive margin obtained from increased revenues is partially offset by the corresponding increase in cost of goods sold experienced from higher volume. Also, a firm typically incurs greater investment to obtain share through lower pricing or higher sales and marketing expenses.
Option 2: Reduce Fixed Asset Investment
A firm can also improve its liquidity position by reducing the amount of capital invested in fixed assets. Some strategies may include:
- Lower the rate of capital reinvestment, allowing for fixed assets on hand to depreciate faster than they are replaced. For companies that believe they have way too many assets on hand, this may be a viable tactic. However, failure to reinvest to at least replace existing assets can lead to longer term productivity issues.
- Sales/Leaseback of property, plant and/or equipment. Many times companies will sell their buildings or land to an outside investment company and then lease the assets back.
Option 3: Improve Working Capital Requirements
An alternative to improving liquidity as measured by NBP is through more effectively managing the metric’s working capital requirement components.
Cash Conversion Cycle
In each of the three working capital component examples for Dry Bean, it appeared impractical to alleviate the 1995 liquidity problem by changing only one of the individual items. An alternative strategy is to take corrective action with all three components simultaneously. The cash conversion cycle (CCC) ratio assists in seeing the potential of taking such action. The CCC combines the days of all three components to provide an estimate as to how long it’s taking cash to circulate within the organization, from the time inventory is built, product sold and bills paid. The ratio is calculated, using the 1995 Dry Bean data, as:
Average Collection Period ____ days
+ Average Days on Hand ____ days
- Payment Deferral Period ____ days
= Cash Conversion Cycle ____ days
Combining the previously mentioned data, Dry Bean experienced a CCC of 17 days (Average Collection Period 8 days, Days on Hand 27 days, and PDP of 18 days). Based on this analysis, management can now provide a pro forma analysis as to what the effect would be on cash flow under various scenarios. Assume management believed that it can decrease the ACP by 2 days, decrease Days on Hand by 10 days, and increase PDP by 10 days. What would be the combined impact on NBP?
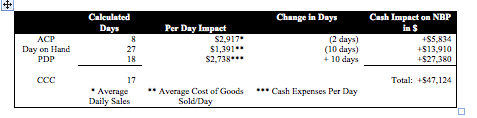
Based on the analysis, management forecasts that it can increase Dry Bean’s liquidity position by $47,124 or put it within $3,000 of a positive position without having to sell any fixed assets or take out new debt/equity positions.
Appendix
Additional Search Terms: Balance sheets, financial statements, financial tracking, money, financial health, financial performance tracking

View Profile

