How to Grow Your Firm the Right Way
For most new business owners, growth is a sign that the business is successful. But depending on that business's financial structures and its commitment to shareholders, growth can complicate things.
This article will introduce a simple but powerful financial metric that provides a realistic idea of how much the company can grow based on its profitability, earnings retention, financial structure and "asset velocity." Once a business owner/manager has identified the current earnings power and liquidity position of the firm, he or she can then ascertain the company’s sales growth based on current financial conditions.
To illustrate this concept, consider the Badger Company, a hypothetical small manufacturer located in the Midwest. Badger experienced rapid growth in sales during its past several years, averaging 25% growth each year from 2012 to 2015. Despite the relentless growth, the firm’s CEO saw her firm feeling the strain of managing the growth. She was not sure how she would be able to continue without taking on more debt or making substantial changes that put her firm at risk.
Sustainable Growth Rate
Professor Robert Higgins, Professor of Finance at the University of Washington-Seattle, noted in the 1970’s that many organizations face the conflict of unrestrained growth with the limitations of established financial policies. Higgins suggested that many companies' financial policies and growth objectives are mutually exclusive, and that companies must explore options to remedy the pitfalls of too much growth. He introduced a version of the “Sustainable Growth Rate” (SGR) financial metric to help business owners and managers identify the levers available to grow sales. The SGR is the annual percentage increase in sales that a firm can afford, given that the firm wants to maintain a given dividend payout ratio from earnings and targeted debt/equity structure without issuing new equity.
The Sustainable Growth Rate (SGR) metric can provide management like the CEO of Badger Manufacturing with a decision-making tool to assess the amount of sales growth the current financial structure can afford. (Note: See Appendix A for information on a more traditional Sustainable Growth Rate formula and its relationship to the formula discussed here).
The SGR Formula
The SGR as posited by Higgins requires four variables that need to be calculated:
- P = Operating Margin or Net Income / Sales
- R = Dividend Payout Ratio, or Dividends / Net Income
- L = Leverage, or Total Liabilities / Equity
- T = Assets / Sales
Sustainable Growth Rate = P x (1-R) x (1+L)
T – {P x (1-R) x (1+L)}
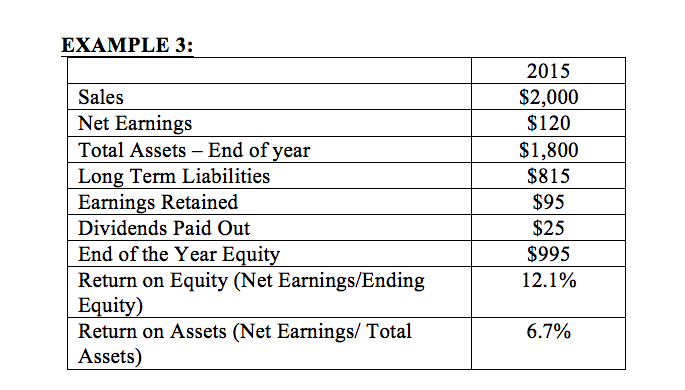
To illustrate, assume that Badger Company (hypothetical) earned $100 thousand in Net Earnings in 2015 as shown in the table below on $2.0 million in sales. Assume the company pays no dividends during 2015.

The following shows the variables included:
- Profit Margin = $100/$2,000 = 5%
- Dividend Payout Ratio = $0 / $100 or 0%
- Leverage = $1000/ $1000 or 1.00,
- Asset/Sales = $2000 / $2000 or 1.0
The Sustainable Growth Rate is 11.1%, as computed below.
(.05) x (1-0) x (1+1.00) = (.10) = .10 = 11.1%
1.0 – {.05 x 1 x 2.00} (1 - .10) .90
In other words, the Sustainable Growth Rate suggests that as long as Badger Company maintains a Profit Margin of 5% and Debt/Equity ratio of 1.0; doesn’t pay any dividends (i.e., retains all profits in the business); and maintains the same Assets/Sales ratio of 1.0, the company can sustain an annual sales growth rate of 11.1%.
If the company’s sales grow higher than 11.1%, it will need to change one of the input variables in the equation (i.e., become more profitable, increase debt in relation to equity, and/or increase Sales in relation to its asset base). Otherwise, the company will face cash shortfalls. On the other hand, if the company sales grow at a rate less than 11.1%, it should generate excess cash.
Effect of Paying Dividends
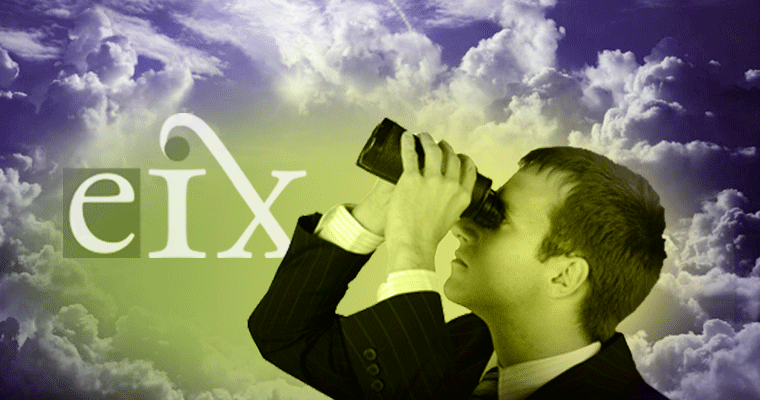
In the original example, Badger Company retained all its profits not paying any dividends to ownership. However, what’s the impact on growth if Badger distributes dividends? Assume that in 2015, the company sets a policy to distribute 25% of Net Income to owners with all other variables remaining the same. Also, any shortfall in funding assets due to lower retained earnings is made up by increasing Liabilities.
To illustrate, assume that Badger Company (hypothetical) earned $100 thousand in Net Earnings in 2015, as shown in the table below, on $2.0 million in sales.
Because dividends were distributed, the earnings retained in Owner’s Equity are lowered by the amount of the dividends paid (this example, $975 instead of $1,000 in the previous) increasing the Leverage Ratio from 1.00 to 1.05 as Liabilities are increased by $25 thousand to offset the lower retained earnings from the dividends (Note – the shortfall could have also been offset by selling stock, reducing assets or a combination thereof).
The recomputed variables adjusted for the payment of dividends are:
- Profit Margin = $100/$2,000 = 5%
- Dividend Payout Ratio = $250 / $100 or 25%
- Leverage = $1025/ $975 or 1.05
- Asset/Sales = $2,000 / $2,000 or 1.0
The Sustainable Growth Rate for this example is computed below.
(.05) x (1-.25) x (1+1.05) = (.077) = .077 = 8.3%
1.0 – {.05 x 0.75 x 2.05} 1 - .077 .923
As a result of the dividend payout, Badger Company’s ability to grow sales is lowered to 8.3% vs. 11.1% per year, or a reduction of 25%. This example is provided to illustrate how a decision to withdraw earnings from the business instead of re-investing the profits back into the company impacts the ability to grow.
Even though the distribution of a company’s earnings to shareholders affects sales growth, management can take steps to offset the effect of payout through a series of other strategies and tactics. They include:
- Grow profits at a faster rate in relation to Sales (i.e., increase Profit Margin)
- Increase Leverage by taking on more debt in relation to equity, and/or
- Reduce Assets in relation to Sales through more efficient management of the asset base.
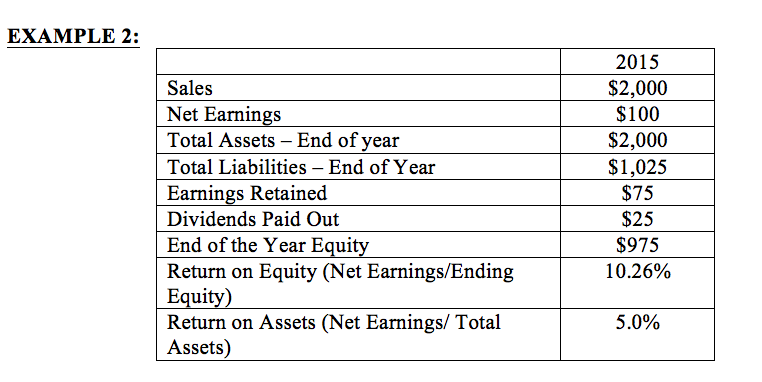
In Badger Company’s case, assume that management believes that through a particular mixture of price increases and cost reductions it can increase earnings to $120 thousand instead of $100 thousand. Also, management thinks that by better managing inventory and accounts receivable they can reduce the overall asset base to $1.8 million from $2.0 million. They still want to maintain the dividend payout of $25 thousand.
Profit Margin increases to 6.7% of Sales due to the higher Net Earnings from our previous example. The Dividend Payout Ratio declines to 20.8% as the amount of dividends remains steady but are paid out of a higher earnings base. Third, the Leverage Ratio, declines to .891 as the Equity portion of the business grew from higher earnings, and finally, the Turnover Ratio declined to 0.9 from 1.0 in the other examples as better inventory and receivable management lowered the total asset base in relation to sales.
As a result, the assorted changes in management actions compensated for the lost growth in sales from the dividend payout by increasing the firm’s sustainable growth rate to 11.9% vs. the previous example of 8.3%. The calculations are shown below.
- Profit Margin = $120/$1,800 = 6.7%,
- Dividend Payout Ratio = $25 / $120 or 20.8%
- Leverage = $815/ $995 or .82,
- Asset/Sales = $1800 / $2000 or 0.9
The Sustainable Growth Rate increases to 6.8% for Badger (computed below).
(.0667) x (1-.208) x (1+.82) = (.096) = .096 = 11.9%
0.9 – {.06 x 0.792 x 1.82} 0.9 - .096 .804
So, all is not lost if the owners/managers decide they want to "take a little cream" off the top in the form of dividends. However, as the aforementioned examples show, if management wants to maintain a foundation of growth, there are tradeoffs in that the business must become more profitable, efficient, and/or take on a greater level of debt to finance its operations.
Caveats with Sustainable Growth Rate
As with any financial ratios, some conditions may render the ratio meaningless and/or not applicable:
No Profits. For companies showing a loss resulting in a negative profit margin % of sales, the sustainable growth rate will not apply. In situations like this, it’s recommended that an organization use a "target profit margin" as goal or proxy.
100% Dividend Payout. If a firm pays out all its dividends, the dividend payout ratio will be 100% causing the sustainable growth rate to be zero. Again, the actual growth rate will have little meaning but an analyst can substitute various payout rates less than 100% to show what potential SGRs might be.
Negative Equity. In some cases, firm may have accumulated deficits that create a negative equity situation on the balance sheet. As can be seen in the formula, this will result in a situation where the SGR is not applicable. One way to address this is to develop a ‘target Leverage ratio’ to show what the SGR could be.
Extreme Leverage. In situations where the firm has an extreme Leverage ratio (very high debt in relation to the equity base), the SGR may result in extreme numbers. First, an analyst should examine if the debt is in fact debt. There may be situations, especially with small companies, where loans or other debt instruments are in fact equity (no interest is paid, no principal has been paid, etc.). In this case, the analyst should reclassify the debt as equity. If there is simply a case of overleverage and the company is in a profitable state, an SGR can be calculated but caution should be used in interpreting the result. Again, more realistic SGRs can be shown with less onerous leverage positions.
Extreme Low Asset Bases. In many service companies, there may be a very low total asset base in relation to sales. As a result, profitable companies with such a base will generate astronomical SGRs. Any interpretation should be careful and only compared within the company and/or within the same industry.
Constant Cost and Asset Functions. The ratio’s variables are assumed constant under a static financial policy as of a particular point in time. For instance, the formula assumes a constant cost function, and not a step function as might occur in manufacturing as an example, if a new facility needs to be built for expansion.
Summary
The Sustainable Growth Rate is a simple but effective tool for gauging how fast a company can grow its sales based on its profitability, earnings retention, financial structure and asset management. It provides management with a guide to benchmark its growth objectives with the reality of the firm’s financial performance and capital structure. As a result, owners/management can develop their plans, ascertain the sustainable growth, and then either adjust their plans or take action regarding their financial strategies to provide for more growth potential.
Appendix A: Alternative Sustainable Growth Rate
Most accounting and finance professionals will recall a more traditional Sustainable Growth Rate that is derived from the Return on Equity, which is slightly different from the Higgin’s SGR formula. The original SGR formula is calculated as follows:
ROE = Net Earnings/Total Equity
ROE = (Net Earnings/Assets) x (Assets/Equity)
ROE = (Net Earnings/Sales) x (Sales/Assets) x (Assets/Equity)
If apply the Retention Rate of earnings (1- Dividend Payout Rate) to the ROE equation, you then have SGR.
SGR = (Net Earnings/Sales) x (Retention Rate) x (Sales/Assets) x (Assets/Equity)
If one applies Example 1 to this formula (no Dividends paid):
SGR = ($100/$2,000) x (1.00) x ($2,000/$2,000) x ($2,000/$1,000)
= (.05) x (1.00) x (1.00) x (2.00)
= (.05) x (2.00) = 10% using the alternative method.
Using the Higgins Model, SGR was calculated as 11.1%, vs. 10% using this alternative model. The reason for this is that alternative model in this example uses end of the year equity balance ($1000) so the Sustainable Growth Rate using the alternative is actually calculating it for the past year at the end of the year or estimating for 2016.
If one subtracts the increase in Equity during 2015 ($100) from End of the year Equity ($1,000 - $100) you can easily calculate Equity at the beginning of 2015 or $900. If the $900 beginning of the year equity is substituted into the alternative model, the SGR is:
SGR using Beg of Year Equity = (.05) x (1.00) x (1.00) x ($2,000/$900)
= (.05) x (2.22)
= .111 or 11.1%, same as original Higgins Model.
References
Higgins, R. A., (1977). How Much Growth Can a Firm Afford? Financial Management, p.8 – 17.
Read More
"You Have Our Permission Not to Grow," Jason Pattit and Katerina Pattit, June 2018
View Profile

